New polling published this week found that 17 million UK adults are either behind on their energy bills or worried about falling behind. Around five million are already in arrears, with a median debt of £750, but most people are unaware they could use a Time-of-Use comparison site.
On 1 July the price cap rises 13%. That’s another £221 added to a typical annual bill, taking it to £1,862. Total household energy debt is already estimated at £5.5 billion and is projected to hit £7 billion by the end of the year.
The UK already has some of the most expensive electricity in the developed world. UK domestic electricity prices were higher than all but one EU member state in the first half of 2025, running 23% above the EU average. In 2024, we had the second highest domestic electricity price of any G7 nation. Only Germany was worse.
So this is a genuine crisis, and it needs a policy response. Better insulation, income support, a proper social tariff. None of that is happening fast enough. But there’s something else going on that nobody is talking about. And it’s the reason we built our smart tariff checker.
The comparison site blind spot
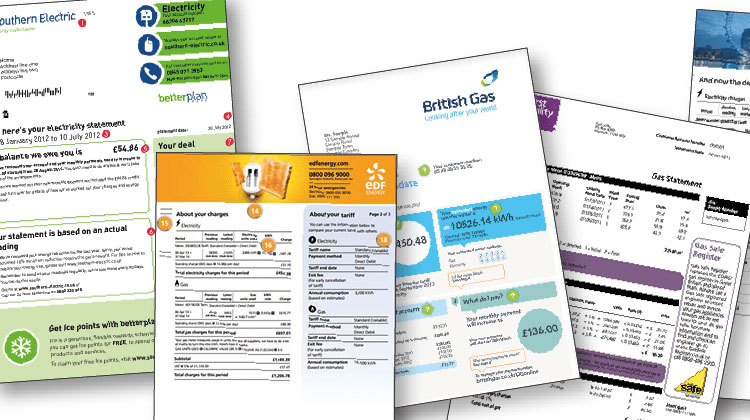
When most people want to find a better energy deal, they go to a price comparison site. It’s what Martin Lewis tells you to do and, for a standard household on a flat-rate tariff, it works reasonably well.
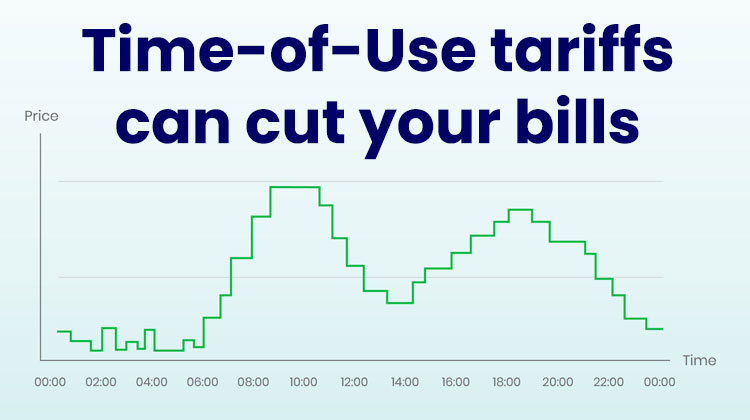
The problem is that the comparison sites most people use, like Uswitch and MoneySuperMarket, don’t show time-of-use tariffs. These are electricity deals that charge different rates at different times of day, with overnight rates currently as low as 7p/kWh compared with around 24.50p/kWh on a standard variable tariff.
For some households, these tariffs don’t make much difference. But for a rapidly growing group — homes with electric heating, electric vehicles, heat pumps, solar panels or battery storage — they can be transformative.
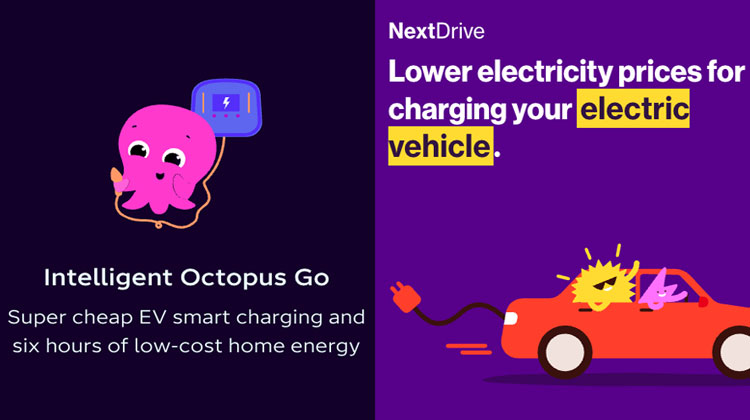
An EV driver who charges overnight could save around £610 a year by switching from a standard variable tariff to a suitable EV tariff, based on our modelling of a London household charging primarily at night. Households running a heat pump on the right time-of-use deal can save £200–£400 a year compared with a standard rate. Our analysis suggests that up to £500 million in annual household energy savings may be going unclaimed across the UK, simply because the right tariffs aren’t visible in the places people go to compare.
That is a staggering amount of money sitting on the table.
Who the Time-of-Use comparison site blind spot affects
The group we’re talking about is bigger than most people realise.
There are now more than two million fully electric cars on UK roads. More than 275,000 homes have certified heat pump installations — with nearly 60,000 added in 2024 alone. Battery storage installations surged 112% year-on-year in 2025.
These are not niche technologies any more. They represent a substantial and fast-growing share of UK households. And they’re the households that standard comparison tools were never really designed to serve.
Only 9% of UK households currently use any kind of time-of-use tariff, despite smart meter coverage approaching 60% of homes. That gap isn’t because people have looked at time-of-use tariffs and decided they’re not worth it, it’s because most people have never been shown them at all.
How to check if Time-of-Use tariff could save you money
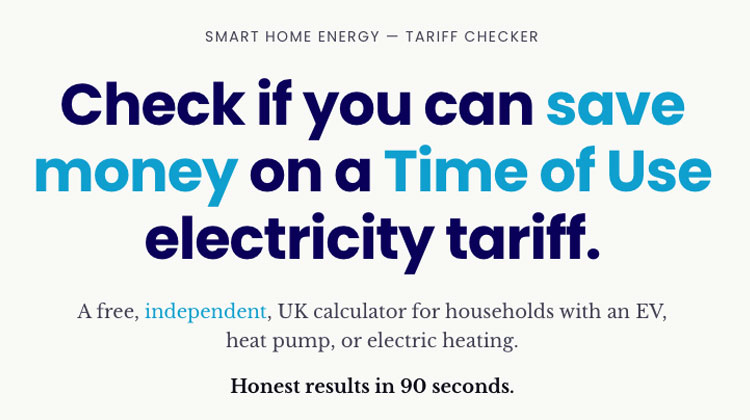
Our Smart Home Energy Time-of-Use comparison site compares 40+ UK electricity tariffs — including 20+ time-of-use deals — and is built specifically for homes with EVs, solar panels, heat pumps and battery storage — and it’s free to use.
It also checks your home’s EPC rating automatically. Once you’ve confirmed your home details, it generates a personalised Home Energy Plan: recommended actions across short, medium and long-term timeframes, which you can mark as done as you work through them. The plan evolves as your home changes, as your circumstances change, and as new tariffs come to market.
We’re not going to solve fuel poverty; That needs urgent government action. But for the millions of households with modern energy technology who are quietly overpaying our tool can help identify genuine savings.
If you want to check whether you could be on a better tariff, it takes a few minutes and it’s free. Check your tariff →
Methodology notes
£500 million unclaimed savings estimate: Based on Ofgem data showing approximately 13 million households on standard variable tariffs (62% of ~21 million electricity customers) and an estimated average saving available to households with time-of-use-compatible technology (EVs, heat pumps, battery storage), estimated at roughly 35% of SVT households based on current technology penetration rates from MCS, Zapmap and DESNZ data. This is a conservative modelled estimate, not an Ofgem or government figure.
£610 EV household saving: Based on Smart Home Energy tariff comparison modelling for a London household with one EV, charging approximately 25 miles of range per night (roughly 5 kWh), switching from the Ofgem Q2 2026 standard variable rate (24.50p/kWh) to Octopus Intelligent Go overnight rate (7p/kWh during intelligent dispatch hours). Assumes 330 charging nights per year. Annual charging cost on SVT: ~£404. Annual charging cost on Intelligent Go: ~£116. Difference: ~£288 on charging alone. Full household bill saving including off-peak daytime usage brings the estimated total to approximately £610. Individual savings will vary based on vehicle, usage pattern, region and supplier availability.
Sources
- End Fuel Poverty Coalition / Opinium polling
- Ofgem price cap announcement, 27 May 2026
- Energy UK analysis, February 2026
- National Energy Action, 2026
- House of Commons Library, June 2026
- House of Lords Library, May 2026
- DESNZ Quarterly Energy Prices, March 2026
- Ofgem State of the Energy Market, January 2026
- Zapmap, May 2026
- MCS installation data